Seoul Pollution
I decided to make this project to horn my data analysis and data managing skills.
The idea was quite simple by following these questions:
- Is there any periodic pattern in Seoul's air pollution?
- Can we trust the openAPI data?
- Can we predict the pattern?
- Is there any correlation between each type of pollution?
- Does the pollution affect people?
By following these simple questions, this project was perform.
Data Collection and Pipline
In this work, we will use a dataset from Kaggle which looks clean at the first sight, however, after analysis I found that the data contains the error.
For example, the concentration of the pollution suppose to greater than zero but somehow the data is negative. Moreover, some point of data is 1000 times
bigger than mean value which is super unnatural. Moreover, the data is Big-scale , the timestamp is collect every single minute which is too fine to be analyzed.
So, dealing with input data and build the data lake are the first step I did in this project by following steps:
- Pull the data by using Kaggle API
- structurize the data into simple form: separate years, district for example.
- Remove the error data by using the statistics. ## very important
- Build the data lake/warehouse by using Pyspark to optimize the performance
- Write every task in Apache-Airflow to get the advantage of tracing the error from logs
- Add and schedule dialy polution API to update the data warehouse
- Visualization and Analyze
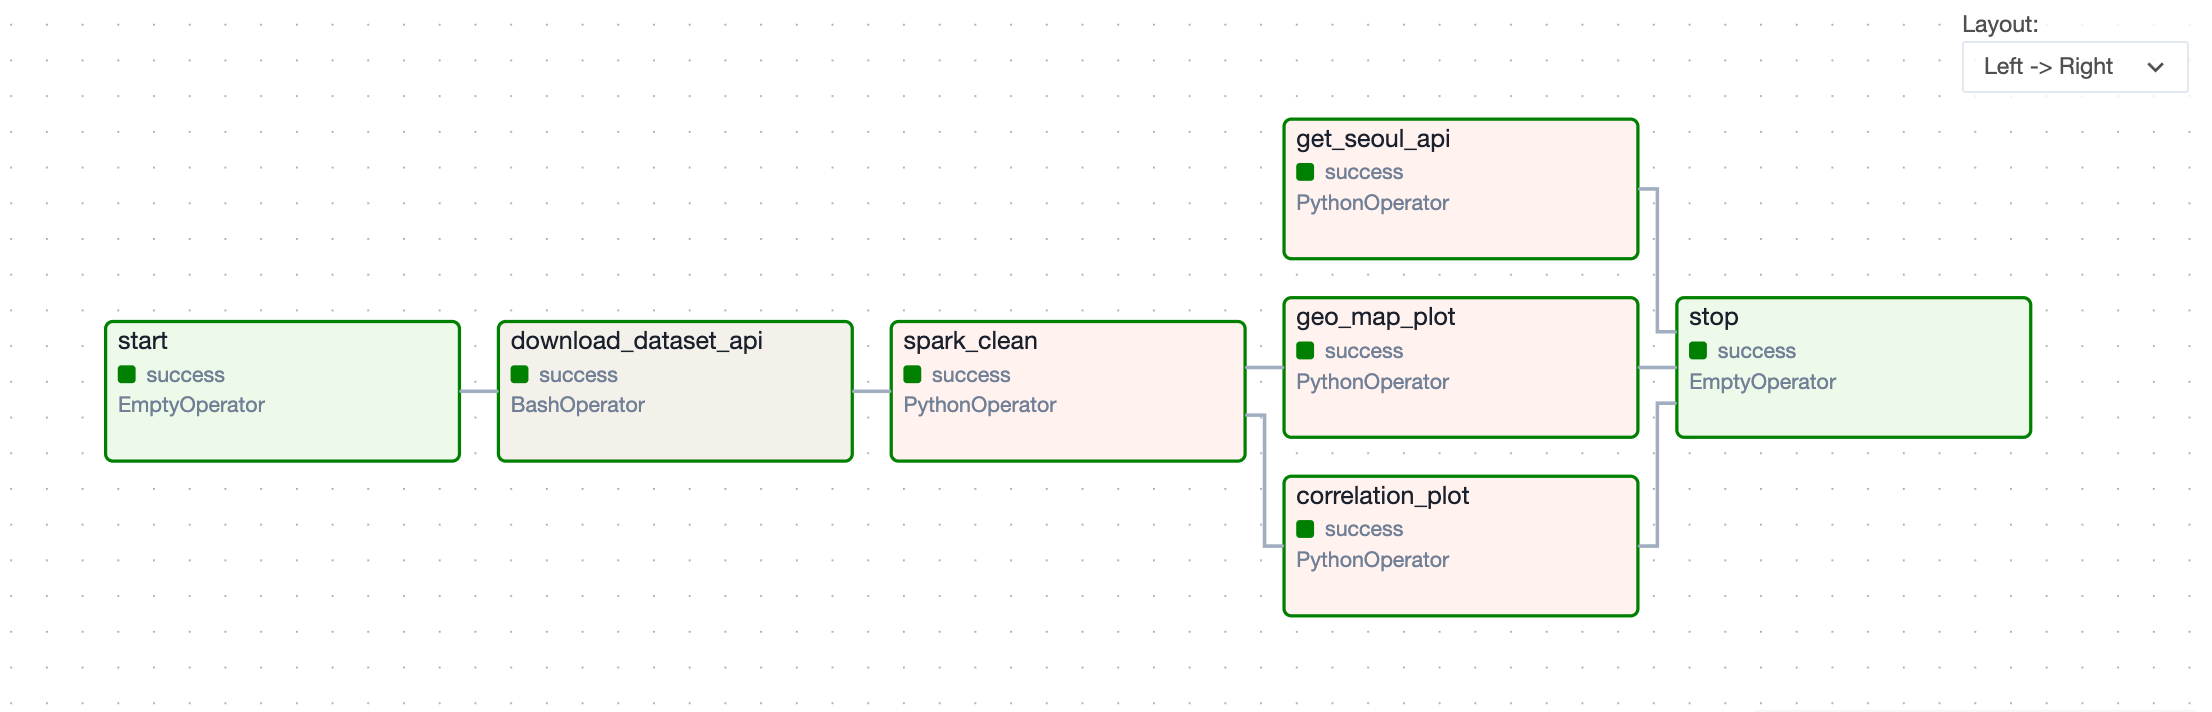
The first simple pipeline is given as follow:
Visualization with Geopandas
One advantage of this dataset is that addresses of the stations are collect. By some data modeling, I can extract just district of each data station and find the average
of the collected data. Moreover, will use GeoSeoul data file which is the information json file including geometry of each district. So, by joining the data, I can embed my data
from my data warehouse into the map:
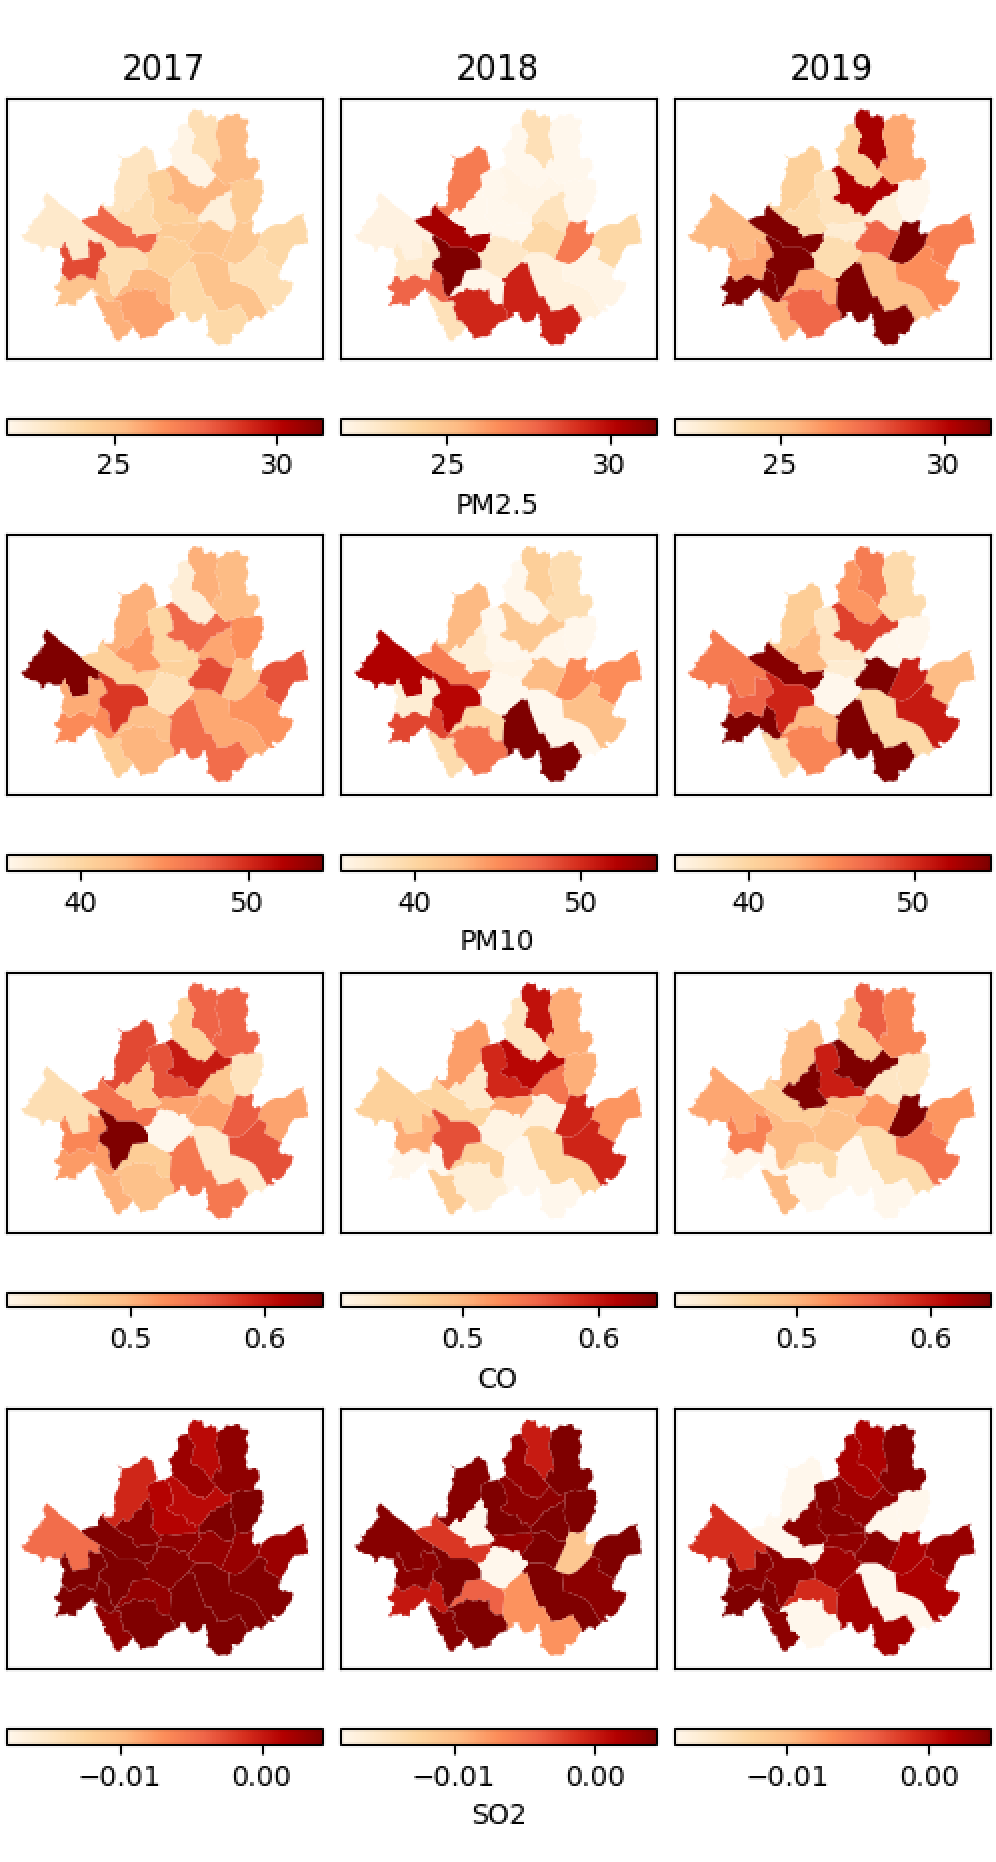
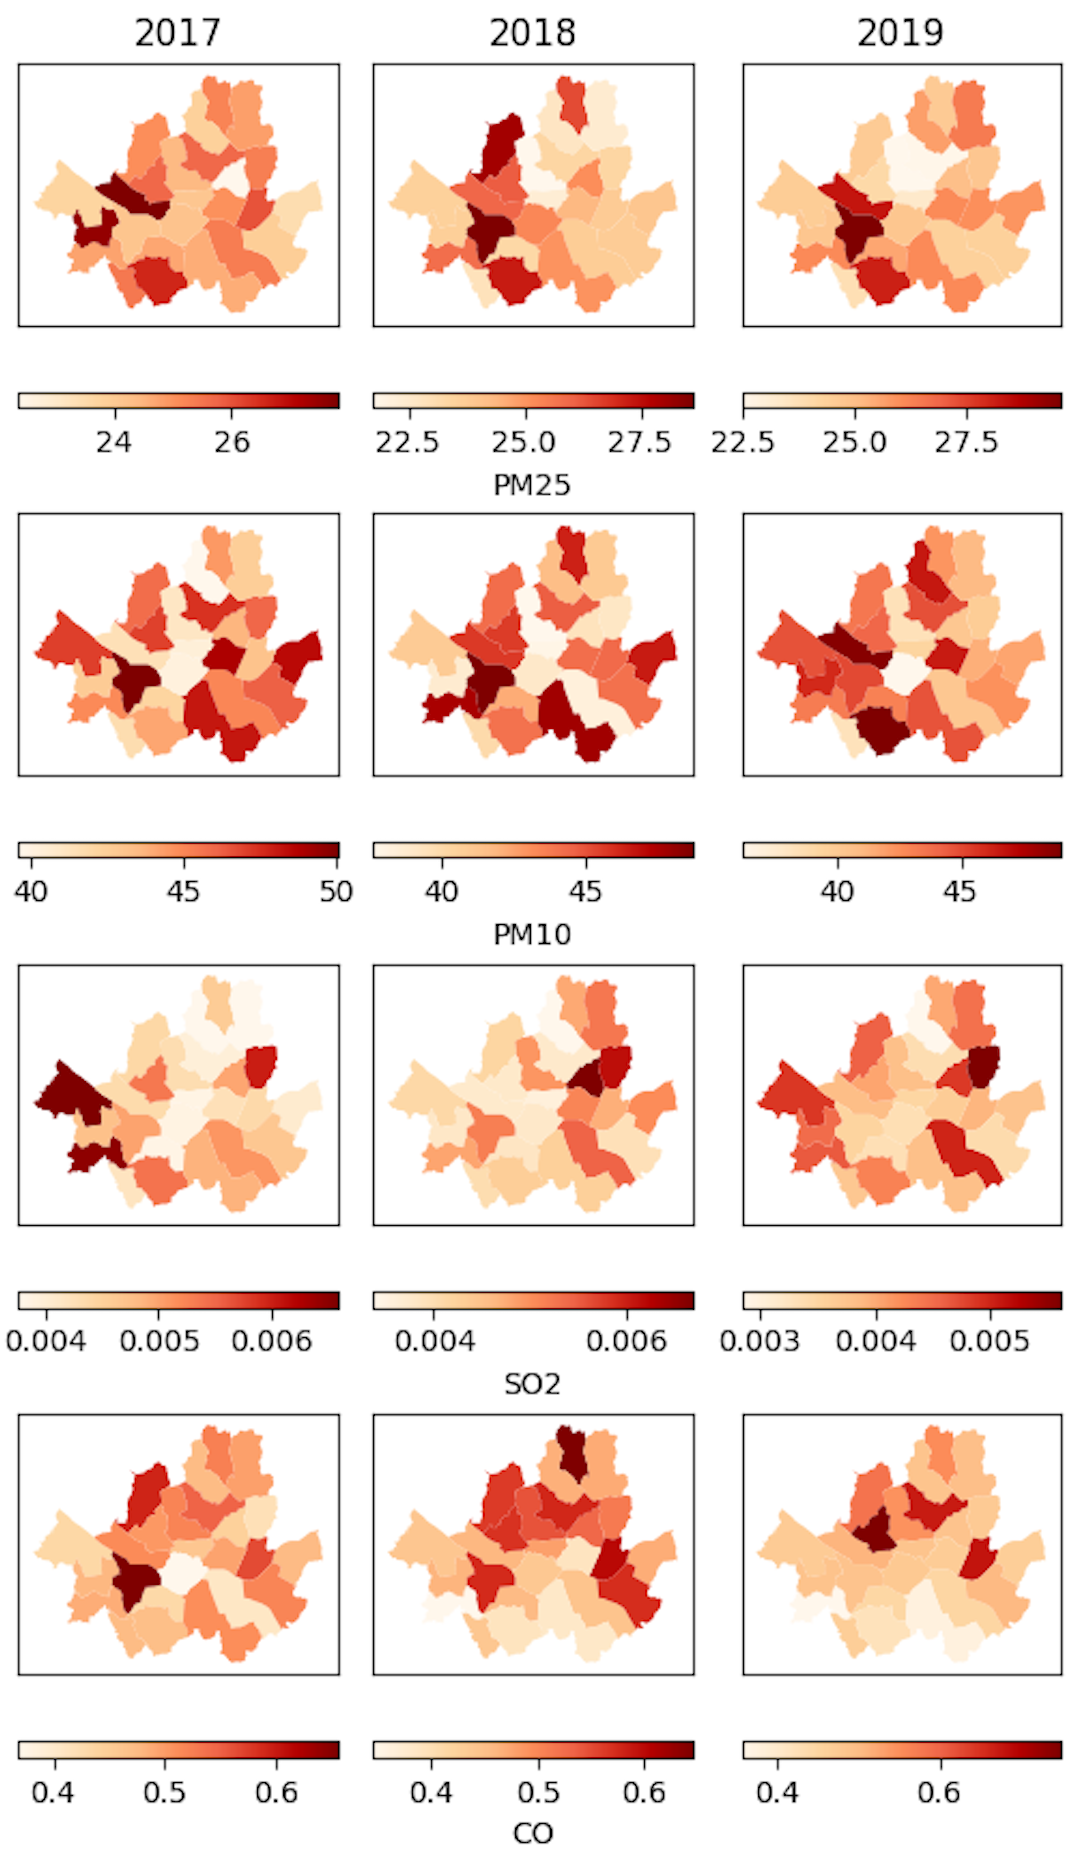
Here, I compare the visualization of data on the map of Seoul where left hand side is the raw data without removing the anomaly data and right the cleaned data.
One can see that the left plots contain the negative values which is not supposed to exist.
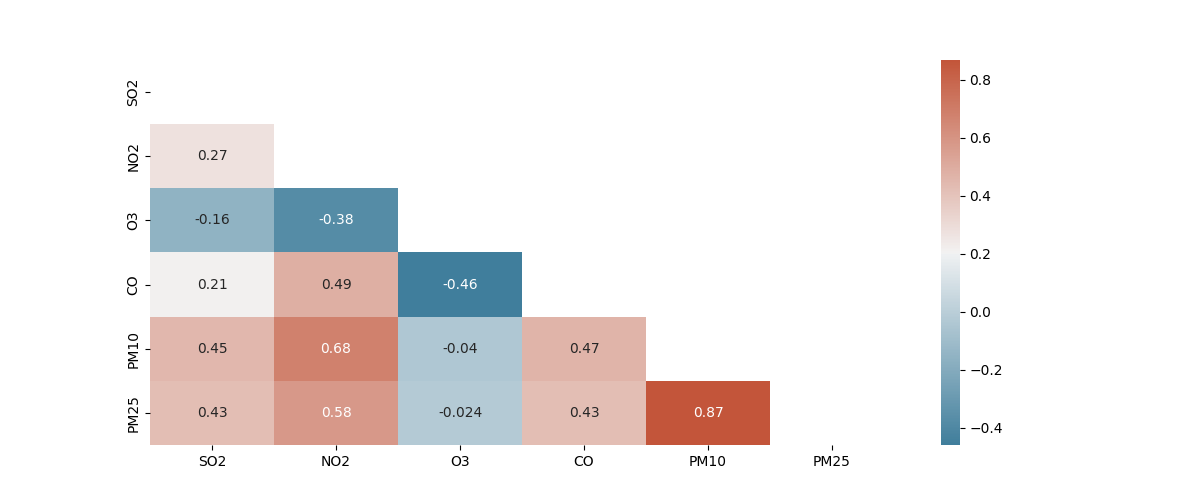
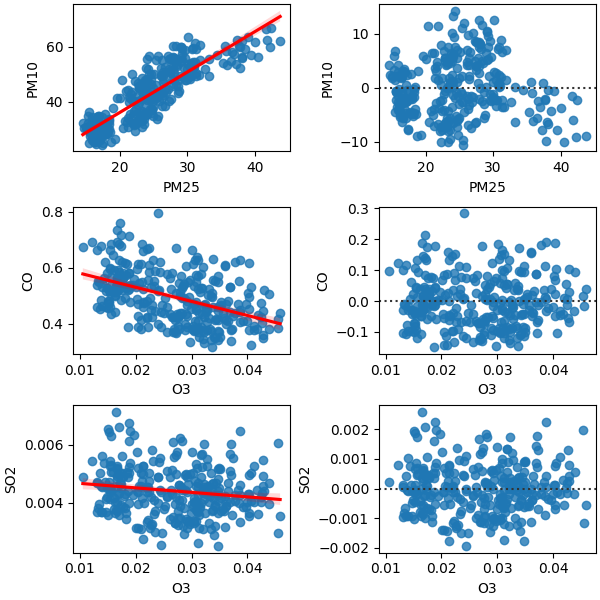
Correlation/ (in)dependency
One of the most important data analysis regardless of field of study is correlation. The correlation tells us how the data relate and (in)dependent to each other. The highly correlated data
usually cause problems in data analysis field people call it collinearity. The collinearity is a situation which the independent feature highly correlate to each other, meaning that they are
dependent!!! So that we cannot say that which feature indeed cuase the target variable and that is fatual situation in ML and data analysis. So, it is a good idea to investigate the correlation of
each feature first.